Maximize Return While Minimizing Risk
Just be sure you're able to tamp down your baser instincts.

Return is to the investor what the smorgasbord is to the glutton: an inexhaustible source of ecstasy, where too much is never enough. Well, at least for the moment. While in the throes of any ecstasy, we find ourselves lost to memories past and to most consequences of the future. How we got here is immaterial. The imprint at the moment is all that matters.
Because moments are transitory, any accompanying ecstasy proves transitory as well. The return to solidity reminds us that nothing exists in a vacuum (or at least it should remind us). Every benefit comes with a cost. There is no free lunch for either investor or glutton, or the rest of the world, for that matter. Emancipated adults acknowledge this reality, though experience has proven to me a surfeit number of post-pubescents never emancipate.
We’ll dismiss our 600-pounder out of hand. We know what costs he bears, and he does, too, if only implicitly. Even those slotted into the bottom decile of IQ — and most relentless gluttons are — know this voluntary beaching on your own bed and the resultant immobility that follows are costs of some sort. Then again, perhaps I am again too generous in my assessment of the human material.
Anecdotal evidence accumulated over 62 years of living and 40 years of investing (35 in a professional setting) convinces me that the average investor is more intelligent than the average glutton. I have more experience with the former than with the latter, thank goodness. Even if I had no experience with either, deductive reasoning would lead me to the same conclusion: those who defer gratification are generally more intelligent than those who indulge immediate gratification; investing is a deferred-gratification behavior.
Most investors are aware their returns come with costs of some sort. Many know them explicitly; others, only implicitly, and those who slot into the latter category too frequently dismiss the connection. They see return and that’s all they see. They are blind to the unavoidable cost embedded in every investment, and that would be risk. This cecity can manifest from ignorance and wishful thinking, and possibly from confusion.
Risk is synonymous with asset-price volatility, with permanent loss of capital, and with uncertainty. If you are slightly more statistically oriented, you hear of risk associated with class probability, the probability of an event occurring within a particular class of similar events where outcomes are known and can be repeated (think of table-game gambling); and with case probability, which applies to unique events that cannot be repeated. Investing slots into this latter category. Obfuscation expands when risk is further atomized to market (systematic) risk, business-specific (unsystematic) risk; and further still to liquidity, credit, price, inflation, agency, management, concentration, currency, and political risks (but these can be generally consolidated into the general systematic and unsystematic categories).
I do believe I’ve overlooked one risk, and it’s the one we will feature for the purpose of this particular missive. I refer to sequence risk — the predominant risk for older investors. Sequence risk refers to the timing of withdrawals, primarily those from a retirement account at the onset of the sunset years.
We’ll assume from here on that the business-specific (or unsystematic) risks are of little concern. We’ll be dealing with a diversified portfolio composed of fund investments, which quelches unsystematic risk. In other words, market (systematic) risk is the primary risk of concern. How much of this you bear is determined by the allocations to the particular asset classes. Different asset classes bear different risk profiles. These risks will determine sequence risk.
Sequence risk is a big deal. To begin drawing down a retirement account during the depths of a major market correction (a la 2001 and 2009) can distort the future into a catastrophe for the investor who failed to consider the risk (i.e., focused solely on return). To begin drawing from a $1 million portfolio trending toward $1.5 million or from a $1 million portfolio freefalling to $500,000 can be to lifestyle what a vacation in Saint Tropez, France is to one in Gary, Indiana.
You could withdraw $7,500 monthly ($90,000 annually) for 25 years from a $1 million portfolio generating an average annual return of 7% before you start sweating. The portfolio would be drawn down to approximately $100,000 by the end of the 25th year. Cut the starting principal in half to $500,000, a possibility had you retired at the outset of the 2008 financial crisis with a higher risk portfolio, and the monthly withdrawal is halved to $3,750 monthly ($45,000 annually). The terminal value after 25 years is also halved.
Those familiar with the petite bourgeoisie’s favorite financial guru, Dave Ramsey, might argue that an 11% or 12% average annual return from the portfolio allocation Ramsey recommends — growth, aggressive growth, growth & income, and international — mitigates the risk. Ramsey will also mention that the S&P 500 has returned to its previous high within five years after a correction. I have run a few scenarios with Ramsey’s portfolio allocations, and 11% to 12% isn’t unreasonable, though it is excessively optimistic. The five-year recovery period is generally right, but it is misleading. Let’s consider the first decade of this millennium.
The stock market endured a punishing correction in late 2002 and early 2003, with the S&P 500 backtracking 45% from the previous high that marked the apex of the internet euphoria in early 2000. All ground lost was reclaimed by late 2006, and the S&P 500 powered to a new high. But then a year later, everything was rinsed and repeated, only with greater agitation. The S&P 500 endured a 55% drawdown instigated by the 2008 financial crisis. The S&P 500 recovered to the 2000 high in December 2010. The 2007 high was reached in April 2012.
So, yes, Ramsey is right with his five-year recovery, but from stem to stern, the 2000s was a lost decade. S&P 500-indexed investors entered 2010 as they entered 2000. And this is us pretending that we would have been indifferent to it all.

Let’s continue with the game. You stay the course; you assume the S&P 500 will continue to generate a 10.5% average annual return. You adjust your withdrawals accordingly. You could adjust your withdrawals to $5,200 per month ($62,400 annually) and make it another 25 years.
Now for the good news. You adjusted your withdrawals based on the 10.5% average annual return rate, but the S&P 500 has generated a 16.5% average annual return since the March 2009 nadir. You remained disciplined and stuck with your 10.5% expectation and the $5,200 monthly withdrawals (without adjusting for inflation). Here you are 16 years later, and your portfolio is worth over $2 million.
So just plow ahead. Well, to say you can absorb a 50% portfolio drawdown and to actually absorb one is the equivalent of saying you can absorb a Mike Tyson left hook and actually absorbing the left hook. We’re all lionhearted when danger is an abstraction. Too often, we revert to the fleeting rabbit when danger strikes before our eyes.
Risk in our particular scenario is associated with volatility, and when volatility appears at the inopportune time, it can lead to capital loss. Risk is also associated with pure loss. You were seduced by the FOMO hype, succumbed to the siren song, and bought a few of those terrible SPAC stocks so popular at the onset of the 2020s. A couple of years pass, the hype subsides, reality sets in, and your capital investment is nowhere to be found. Unsystematic risk offers the possibility for an investment to end at zero.
Because I’m entering the Buick-driving years, and I yearn to forestall my dotage for another 20 years thereafter (assuming I’ll be in a physical state to forestall), I consider risk much more today than in my earlier years when I was deluded by a belief in immortality. I have four risk measures I consider most when vetting the landscape. (We are, as I remember, considering systematic isk from a portfolio perspective, but these measures are applicable to individual publicly traded investments — stocks, bonds, MLPs, REITs, etc.) They are as follows: maximum drawdown, volatility, and Sortino and Calmar ratios. There are other statistical measures, but I find these four are readily reported and useful. When eyeing the numerical print of the first two, the lower the better; for the second two, the higher the better.
The maximum drawdown metric is the most telling. I eye this metric after eyeing average annualized returns, sometimes reported as compound annual growth rate (CAGR). Max. drawdown insinuates the pain to expect from the next market correction based on the pain experienced during the worst drawdown that occurred during past market corrections. The measure is straightforward. It is the measure of the worst price retreat that occurred from a previous high during a bear market over the trading history of the portfolio (or individual investment.) I like the sobering effect this metric imparts.
Volatility measures the dispersion of returns. It quantifies the up and down price movements over a specific period. That is, it measures the magnitude of these movements, not the direction. An asset that moves up 5% and down 5% on alternating days has the same volatility as one that jumps up 10% and down 10%—even though their overall performance is vastly different. The calculation treats upward price swings the same as downward ones, though most investors are concerned only with the downside.
The Sortino ratio offers additional insight into volatility. This risk-adjusted metric measures how much excess return an investment earns per unit of "bad" risk, specifically downside deviation, rather than total volatility. The ratio tells investors how much return an investment had made beyond its specified benchmark (often the risk-free rate) for every unit of negative volatility. A higher Sortino ratio means the investment generated more return per unit of downside risk taken (a good thing).
The Calmar ratio nuances the max. drawdown. This risk-adjusted metric compares an investment's annualized return to its maximum drawdown, helping investors assess returns relative to the worst episode of loss. The Calmar ratio measures the average annual compounded rate of return of a portfolio (fund or security), divided by its largest drawdown (peak-to-trough loss) over a specified time frame. A high Calmar ratio means the portfolio (or investment) produced strong returns relative to its worst historical loss.
It’s all relative, of course. Is a 10% CAGR a reasonable return? Is a 40% max. drawdown really so bad? And what do those Sortino and Calmar ratios tell us anyway? We need a benchmark, which leads to more questioning: What is the proper benchmark?
The answer is less obvious than one might expect. Benchmarks, much like the many sects of Protestantism, have been teased from the ether to satisfy bespoke prejudices. (Fund managers seek the benchmark most accommodating to their investment style.) Let’s adhere to Occam’s Razor, because the simplest is often the best. The S&P 500 is the best, for it is simple and has gained the widest currency as a benchmark. Whether stocks, bonds, real estate, alternative assets, private equity and credit, cryptocurrency, investors — for ill or good — are wont to compare the returns of everything against the S&P 500.
We’ll begin with the most ubiquitous of portfolios, particularly among those investors of older vintage, the classic 60/40 portfolio, composed of 60% stocks, usually an S&P 500 ETF, and 40% U.S. Treasury securities, usually with some laddering of maturities. We’ll stack the classic 60/40 against the S&P 500 and see what the ancillary numbers reveal about events over the past 20-some-odd years.
U.S. Treasury securities, backed by the taxing authority of the federal government, are naturally lower risk and mostly lower return compared with stocks over time. Investors are offered more return assurance and generally lower volatility. A portfolio whose risk has been muted with U.S. Treasury securities should reasonably expect lower returns over time, and time has confirmed expectations. In the particular time frame of the past 23 years, the S&P 500 generated an 11.2% CAGR compared with the classic 60/40 portfolio’s 8.9% CAGR, but when we scratch the surface a little more, we find the forfeiture of return was compensated with lower risk (i.e., more tranquility).
The max. drawdown for both portfolios occurred during the depths of the 2008-2009 financial crisis. The classic 60/40 portfolio suffered a 28.6% max. drawdown during that particular circus; the S&P suffered a significantly more harrowing 55.2% max. drawdown. The difference in monetary terms is more telling: A $1 million portfolio descends to $714,000 with the classic 60/40 allocation; the same portfolio descends to $448,000 with a straight S&P 500 allocation.
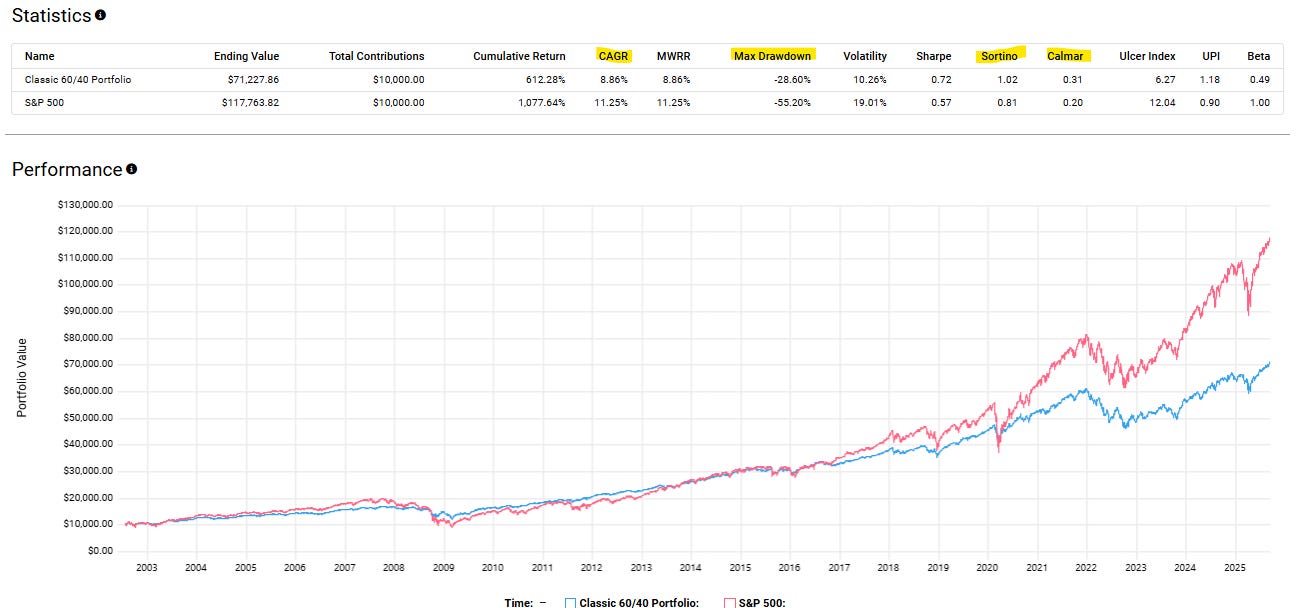
We can argue that the classic 60/40 portfolio is the more efficient portfolio when return is measured against risk taken, which no one knows at the outset. The actual extent of the risk endured for the return received is revealed only ex post. The classic 60/40 portfolio offers less return over time, but it’s max. drawdown, volatility, Sortino, and Calmar ratios show (ex-post) that the return was more “efficient” than the S&P 500 for risk taken.
Time must also be considered. If the prospect of drawdowns resides decades in the future, then the importance of these risk measures diminishes. Return potential holds center stage with risk playing a reduced role. (Again, we are talking systematic risk.) We can find remarkably remunerative examples of going all-in, like our 600-lb walrus-to-be at the buffet, without thought of moderation (of risk).
Bitcoin, a defiantly deceptive asset of utopian returns so frequently interluded with episodes of rug-pulling pranksterism, is the readiest example. For those able to maintain a Jobian equanimity, ignore the interlude of investor hi-jinks, and focus an unmoved gaze on the distant horizon, only munificent wealth awaited. We are talking about the investment world’s version of the Big Bang.
The extremes of it all reveal the potential: a $1,000 allocation to Bitcoin at the outset left unmolested over the ensuing 15 years to the present has boomed into a $1.18 billion (yes, billion with a “b”) allocation. That’s what 151.3% average annualized growth will do for you.
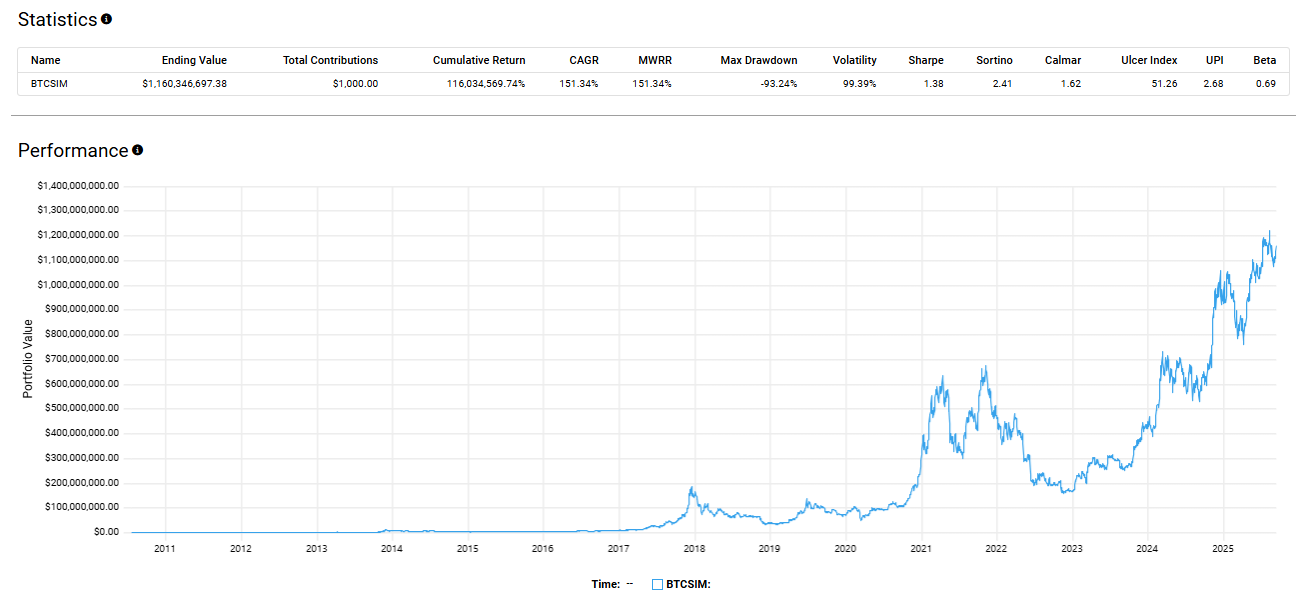
We are helpless but to think “if only” when we daydream about winning Powerball. The odds were better with Bitcoin, but only slightly. Who among us mortals can endure a 93% max. drawdown and frequent drawdowns, with too little of an interval in between, of 50% or more? Volatility approaching 100% is another emotional impediment. And you can be sure that the news that accompanies each major drawdown and every volatility spike is never good. “If it bleeds, it leads” is an honest assessment of news reporting, as epicaricacy is the honest reaction when Joe Biden face-plants multiple times while ascending a jet’s boarding stairs. If the worst can be accentuated, you can be sure it will, and to the glee of the majority.
Despite the Oceangate depths of the drawdowns and the frequent episodes of vertigo-inducing volatility, the statistics tell a story of efficiency. Bitcoin’s Sortino and Calmar ratios are miles ahead (twice, to be precise) of those of the classic 60/40 portfolio and the S&P 500, which are much staider in returns and risk. The statistician tells us that Bitcoin wins because “excess return per unit of negative risk” was far greater with Bitcoin.
(Sidebar: An investor can wander into the statistical thicket and soon find himself lost in the numbers: In addition to the Sortino and Calmar ratios, we can calculate arithmetic and geometric mean, standard deviation, Sharpe ratio, Treynor ratio, R-squared, value-at-risk, skewness, excess kurtosis, and more. Finance, like economics, is keen to borrow the lingo and tools of the natural sciences, mostly to the user’s detriment. Finance, like economics, doesn’t lend itself to the tools of the natural sciences. What is “excess return per unit of negative risk”? It’s an exercise in scientism. The calculation is as useless as the “utils” calculation is in economics. Greek-lettered equations in finance, as those in economics, are as likely to obfuscate as they are to inform.)
When your initial investment is priced at a fraction of a cent per unit and a unit is priced at $115,000 today, you have hit the Powerball. But it’s all in arrears. It’s obvious today, as is picking yesterday’s winning Powerball numbers. In 2010, no one knew that Bitcoin would generate a 151.3% CAGR over the subsequent 15 years, just as everyone knows today Bitcoin has no chance of generating a 151.3% CAGR over the next 15 years. (If it were to happen, the $1,000 initial investment would grow to $6.7 trillion.)
Most of us operate within the confines of the bell curve — with established investments of a pedestrian nature. Here, we can find value in past numbers, because the past has a higher probability (the statistics suggest) of being prologue. Maximum drawdown is certainly a consideration, and if the Sortino and Calmar ratios offer further evidence of efficiency compared to the benchmark or a portfolio of similar construction, all the better.
I offer three portfolios of my doing and a few more of others’ doings. The first two are for investors of a younger vintage and/or a higher risk-tolerance. They are loosely constructed on the predicates of the classic 60/40 portfolio, with three significant deviations: altered allocation percentages, the addition of gold, and the introduction of leverage. Both portfolios are backtested with rebalancing (to the original allocations) occurring quarterly. The S&P 500 serves as our benchmark.
The first is a 3X leveraged portfolio composed of 75% S&P 500, 7.5% long-term Treasury bonds, 7.5% intermediate Treasury notes, and 10% gold. I used leveraged ETFs, available to all, for the four allocations. They are as follows:
ProShares UltraPro S&P500 (UPRO) — 75% Allocation
Direxion Daily 20+ Year Treasury Bull 3X Shares (TMF) — 7.5% Allocation
Direxion Daily 7-10 Year Treasury Bull 3X Shares (TYD) — 7.5% Allocation
ProShares Ultra Gold (UGL) — 10% Allocation
(Note: the ProShares Ultra Gold ETF offers 2X leverage to gold. There are no 3X leverage gold ETFs.)
I throttle back the leverage and exposure to the S&P 500 in the second portfolio. I use 2X leveraged ETFs for this construction. The portfolio is composed of 70% S&P 500, 10% long-term Treasury bonds, 10% intermediate Treasury notes, and 10% gold. The four 2X leveraged ETFs employed for the purpose are as follows:
ProShares Ultra S&P500 (SSO) — 70% Allocation
ProShares Ultra 20+ Year Treasury (UBT) — 10% Allocation
ProShares Ultra 7-10 Year Treasury (UST) — 10% Allocation
ProShares Ultra Gold (UGL) — 10% Allocation
I’ll assume we were all blessed with modest but consistent means and good habits. We started investing 15 years ago, when we were mere lads (or ladesses?), with $1,000 at the start and $100 a month every month thereafter. We faithfully rebalanced the portfolio to the original allocations every quarter. After 15 years, our disciplined risk-accepting selves owned a portfolio valued at $197,337. Had we traveled the less aggressive, though every bit as disciplined, route, we’d own a portfolio valued at $97,280. A market-tracking investor adhering to the same parameters investing in the S&P 500 finds his (or her) portfolio valued at $68,542.
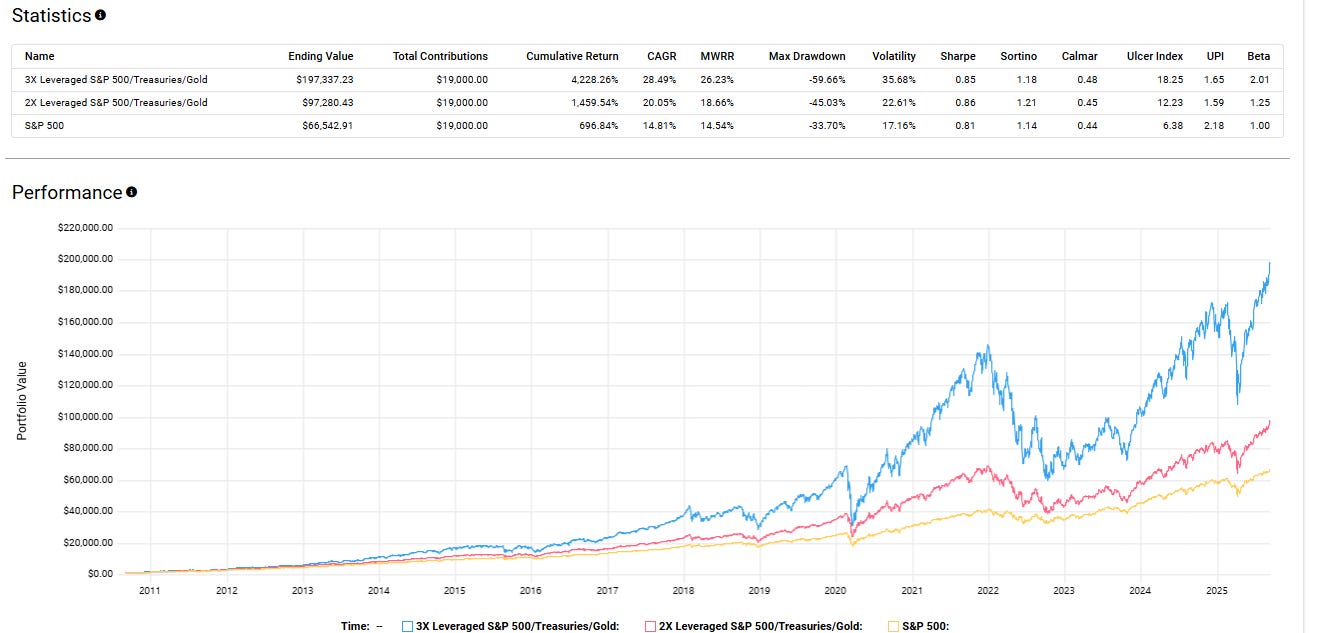
All three strategies involve investing $19,000 over 15 years. The 3X-portfolio investor finds himself with a portfolio valued at nearly $200,000 — 10 times the capital commitment. The 2X-portfolio investor has accumulated nearly $100,000 — five times the capital commitment. The market-tracking investor owns a portfolio approaching $70,000. His portfolio is valued at a little over 3.5 times the capital commitment.
It wasn’t free. Risk-accepting investors endured a 60% max. drawdown, while less aggressive investors endured a 45% max. drawdown. A market-tracking investor didn’t escape scot-free. He endured a 34% max. drawdown. The CAGR of each was 28.5%, 20.1%, and 14.8%, respectively. The return realized by leveraged investors more than compensated for the risk taken. Both portfolios have higher Sortino and Calmar ratios compared with the S&P 500.
(Sidebar: I inevitably receive pushback when I write favorably of leveraged ETFs as portfolio components. “They settle daily, so they don’t track the underlying index dollar for dollar over time.” “They are only trading instruments because volatility decay erodes their value.” The detractors have a point to a degree. Most leveraged ETFs will fail to track the underlying index dollar for dollar. Terminal values will even diverge widely in opposite directions. Volatility decay will erode value to the point the ETF will need to be reverse split to maintain its listing.
But only to a degree. The right leveraged ETFs, namely those that track a broad-based index that historically tracks higher through time, will perform close to what you would expect. For example, the ProShares Ultra S&P500 is a senior leveraged ETF. It has existed since 2006. It endured the punishing financial crisis of 2008-2009. It has never needed to reverse split to remain listed. On the contrary, it has had three 2-for-1 regular stock splits. Its CAGR over the 19 years has been four percentage points higher than the unleveraged S&P 500. Most importantly, ProShares Ultra S&P500 terminal value today is not twice the S&P 500’s. It’s 2.5 times based on our investing parameters of $1,000 down and $100 a month.
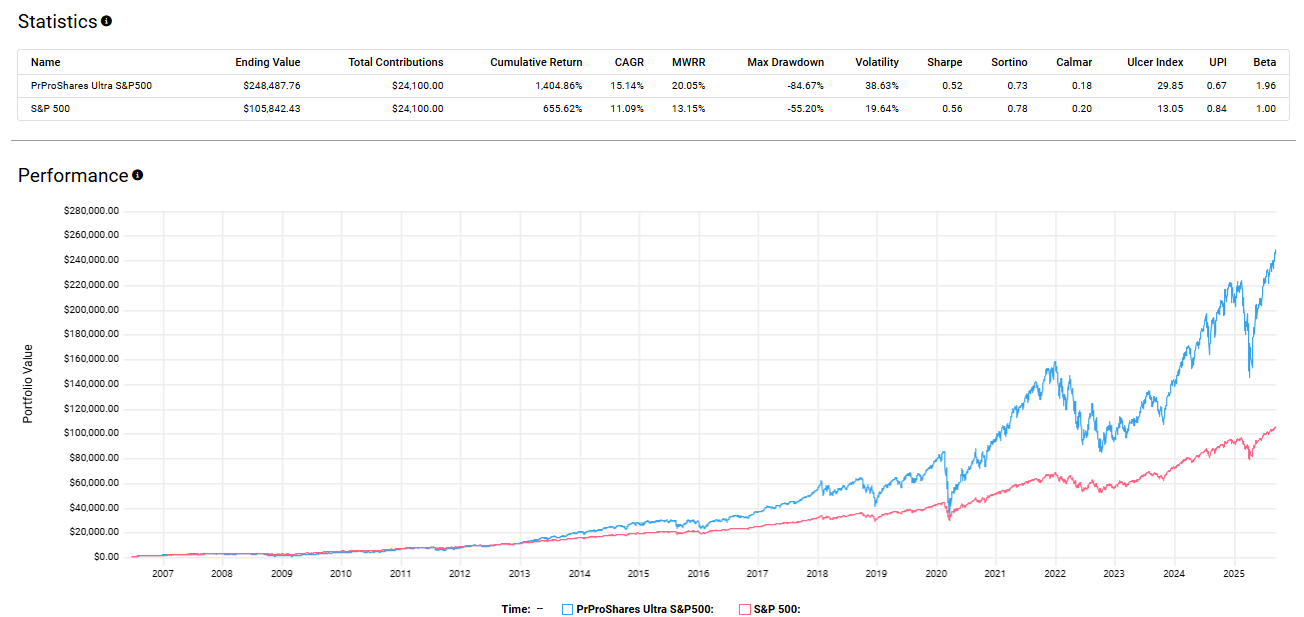
I would never recommend a leveraged one-ETF portfolio. It’s too much volatility, with the potential of too harrowing a max. drawdown. The ProShares Ultra S&P500 endured an 85% max. drawdown during the worst of the financial crisis. The statisticians tell us, through the mysticism of the Sortino and Calmar ratios, that the Proshares’ CAGR, as a sole portfolio, insufficiently compensated for the risk endured. That said, it met expectations on creating wealth over time.)
Let’s assume now that we kept at it with the same $100 per month for another 15 years. We’ll also assume that the same return and risk parameters prevailed for the next 15 years (unlikely, to be sure, but the deviations shouldn’t transport us too far afield). We find our 3X portfolios valued at $8.7 million; our 2X portfolios valued $1.6 million. The straight S&P 500 investor finds his portfolio valued at $604,000.
We have another tidbit worth remembering: Terminal velocity always occurs on the back nine. It can feel as if nothing worthwhile is happening through the first two decades, and then it all seems to take sudden flight. (Warren Buffett didn’t become a billionaire until he was nearly 60; he’s worth over $100 billion today.) Too many investors become discouraged during those first two decades, and they abandon ship just when land is about to appear on the horizon. “Patience, double-oh-seven, patience,” our favorite secret service agent was wont and right to remind himself.
We’ll swing to the other end of the pendulum to those approaching or who are in retirement. The scheduled recurring payments that arise from employment cease, possibly to be replaced by social security, pension, and annuity payments, and possibly in amounts less profess compared to the former payments that employment engendered. In some instances, the investment portfolio may be needed to compensate for shortfalls or to carry the full load.
Sequence risk ceases to be theoretical and becomes quite palpable when the hair around the temples shades gray and the eyes at the corners sprout crow’s feet. What if the day when I walk out the door with the gold watch coincides with the day I confront a market correction? I can endure a 60% max. drawdown when I’m 39, but not so much when I’m 59 and beyond. The portfolio should be adjusted to the new reality.
If mitigating volatility is job one, a portfolio composed of one-to three-month Treasury bills will do the trick. We confront a minor irritant, though: What we gain in muted volatility we lose in purchasing power over time. The SPDR Bloomberg 1-3 Month T-Bill ETF (BIL) has been only marginally more volatility than the EKG reading of the deceased since it was introduced 18 years ago. Its 1.3% CAGR over the same period is no better. A portfolio that regularly trails consumer price inflation by a percentage point or two annually is assured to lose purchasing power over time.
(Note: When someone mentions a “risk-free” investment or the “risk-free” rate, he is usually referring to the yields on short-term Treasury bills. The reality is there is no such thing as “risk-free.” Every mitigated risk comes at a cost, and to mitigate every risk is a fantasy. Cheap, right, fast — pick the two you value most, because you’re forfeiting the third. A similar paradigm exists when picking investments. Choose the risk you're willing to endure and accept the concordant reward, or determine your minimum reward and accept the concordant risk.)
To generate a return that at least maintains purchasing power, you must be willing to tolerate something that makes you squirm occasionally. Long-dated Treasury bonds and notes can maintain purchasing power, though we have no guarantee. The securities are at the lowest risk of default, but the price can be volatile at times, particularly when interest rates are rising, as we saw in 2022. You’ll suffer no capital loss if you hold the security to maturity. You can lose money if you need to sell before then, when interest rates are rising. Plenty of money was lost selling Treasury bonds three years ago.
(Sidebar: You might remember the growing worries in 2022 that banks could start to fail en masse because so many of them were holding a portfolio of bonds whose market value was far below the bank’s cost basis. One bank failed with much fanfare. Silicon Valley Bank was forced to recognize billions of dollars in unrealized losses. The predicament was exacerbated by a bank-run on deposits that caused the bank to collapse despite its investment portfolio comprising mostly long-dated Treasury securities.)
You can find many prepackaged investment portfolios geared toward conservative investors. I’ve devised my own, which I think stands on its own merit. My portfolio consists of a 40% allocation to stocks, a 25% allocation to Treasury notes, a 15% allocation to Treasury bills, and a 20% allocation to gold. I give you the portfolio and the ETFs that satisfy the allocation.
The Mauzy Portfolio
SPDR Portfolio S&P 500 ETF (SPLG) — 25% Allocation
Amplify CWP Enhanced Dividend Income ETF (DIVO) — 15% Allocation
Vanguard Intermediate-Term Treasury Index Fund ETF (VGIT) — 25% Allocation
iShares 0-3 Month Treasury Bond ETF (SGOV) — 15% Allocation
SPDR Gold MiniShares ETF (GLDM) — 20% Allocation
But enough of me; let’s consider a little of them. The following four portfolios feature conservative allocations that I found repeated more than most in the investment blogosphere. The investment classes and the allocation percentages are theirs; the ETFs used to satisfy the criteria are mine.
The Dalio All Weather Portfolio is first up. It is Bridgewater Associates’ founder Ray Dalio’s bone-toss to the investing hoi polloi. The portfolio is composed of 30% stocks, 40% Treasury bonds, 15% Treasury notes, 8% gold, and 7% commodities.
Dalio’s All Weather Portfolio
Vanguard Total Stock Market Index Fund ETF (VTI) — 30% Allocation
Vanguard Long-Term Treasury Index Fund ETF (VGLT — 40% Allocation
Vanguard Intermediate-Term Treasury Index Fund ETF (VGIT) — 15% Allocation
SPDR Gold MiniShares ETF (GLDM) — 8% Allocation
Invesco DB Commodity Index Tracking Fund (DBC) — 7% Allocation
The next portfolio, Browne’s Permanent Portfolio, is the longest tenured of the conservative portfolios being profiled. It was conceived in the 1980s by investment advisor, prominent libertarian activist, and lecturer and writer Harry Browne. The portfolio is allocated 25% to domestic stocks, 25% to Treasury bonds, 25% to cash (so Treasury bills), and 25% to gold. Browne has the highest allocation to gold, which is no surprise given his libertarian bona fides.
Browne’s Permanent Portfolio
Vanguard Total Stock Market Index Fund ETF (VTI) — 25% Allocation
Vanguard Long-Term Treasury Index Fund ETF (VGLT) — 25% Allocation
iShares 0-3 Month Treasury Bond ETF (SGOV) — 25% Allocation
SPDR Gold MiniShares ETF (GLDM) — 25% Allocation
The Risk Parity Portfolio is a different riff on Dalio’s all-weather concept. The portfolio holds multiple investments across different asset classes to position itself closer to a market-neutral concept. The allocation seeks to generate positive returns when the economy is growing, to preserve capital during economic contractions, and to preserve real rates of return when inflation rises. The portfolio is allocated 25% to long-dated Treasury bonds, 25% to Treasury inflation protection securities (TIPS), 25% to global stocks, 15% to natural resources, and 10% to gold.
Risk Parity Portfolio
Vanguard Extended Duration Treasury Index Fund ETF (EDV) — 25% Allocation
PIMCO 15+ Year U.S. TIPS Index ETF (LTPZ) — 25% Allocation
Vanguard Total World Stock Index Fund ETF (VT) — 25% Allocation
SPDR S&P Global Natural Resources ETF (GNR) — 15% Allocation
SPDR Gold MiniShares ETF (GLDM) — 10% Allocation
The name says it all for the next portfolio. The Ultra Conservative Portfolio offers the lowest volatility, and therefore the lowest risk, of the five. And because free lunches are a fiction, it offers the lowest return. The portfolio is allocated 82% to short-term Treasury notes, 4% to municipal bonds, and 12% to a diversified stock strategy. The portfolio generates sufficient return to maintain purchasing power, but not much more.
Ultra Conservative Portfolio
iShares 1-3 Year Treasury Bond ETF (SHY) — 82% Allocation
iShares National Muni Bond ETF (MUB) — 2% Allocation
Invesco Municipal Opportunity Trust (VWO) — 2% Allocation
SPDR Portfolio S&P 500 ETF (SPLG) — 2% Allocation
Vanguard FTSE Developed Markets Index Fund ETF (VEA) — 6% Allocation
Vanguard Small-Cap Index Fund ETF (VB) — 6% Allocation
We rear-view mirror the five portfolios back to 2016, and we find the Mauzy Portfolio (of yours truly) offers the highest CAGR, the second-to-lowest max. drawdown, middle-of-the-pack volatility, and the highest Sortino and Calmar ratios. My portfolio was the most efficient and highest return of the pack.
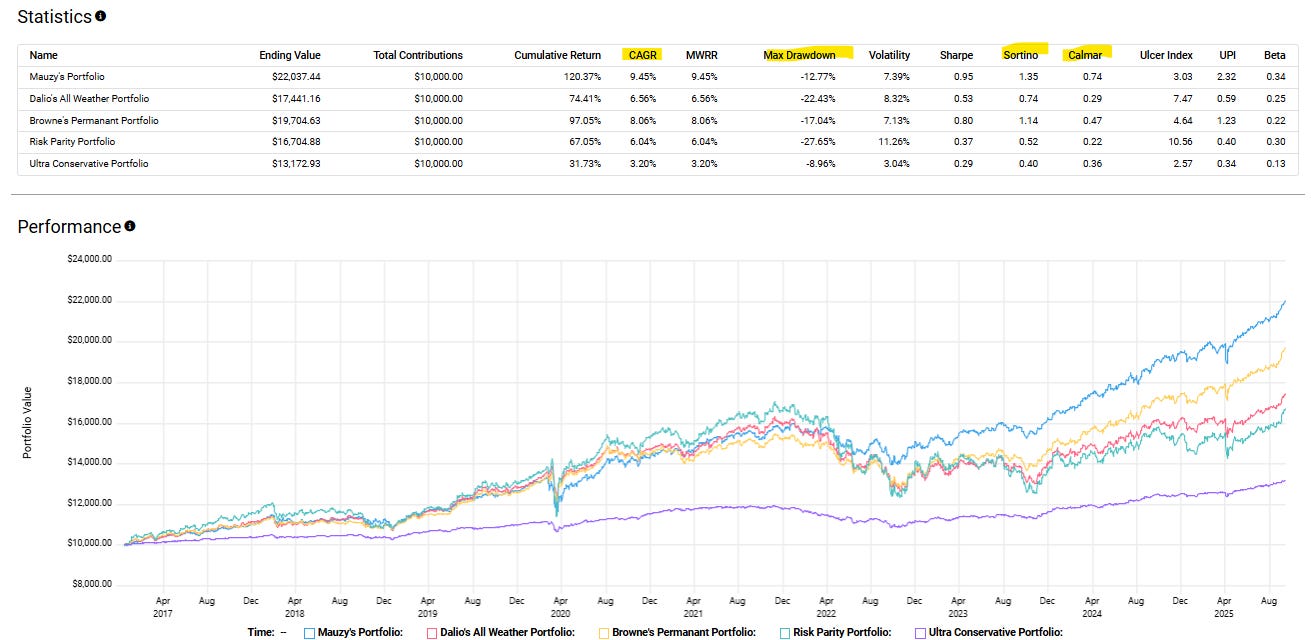
Well, good for me, but I’m too modest (and too honest) to embark on a victory lap. For one, it was to be expected. My portfolio has the largest allocation — at 40% — to equities. My portfolio benefited doubly because it has no allocation to long-term debt, which took a beating in 2022 when the Federal Reserve raised the federal funds rate at an unprecedented pace. Long-term bonds benefit the most when rates fall; they suffer the most when they rise.
For the cause of transparency, let’s wrap it up before the Federal Reserve went on its rising-rate bender and the subsequent hangover suffered by bond investors. Under this scenario, my portfolio is shuffled back to the middle of the pack. The Risk Parity Portfolio is shuffled to the front, followed by Dalio’s All Weather Portfolio. (The Risk Parity Portfolio still has the highest max. drawdown, suggesting a portfolio undeserving of its name.)
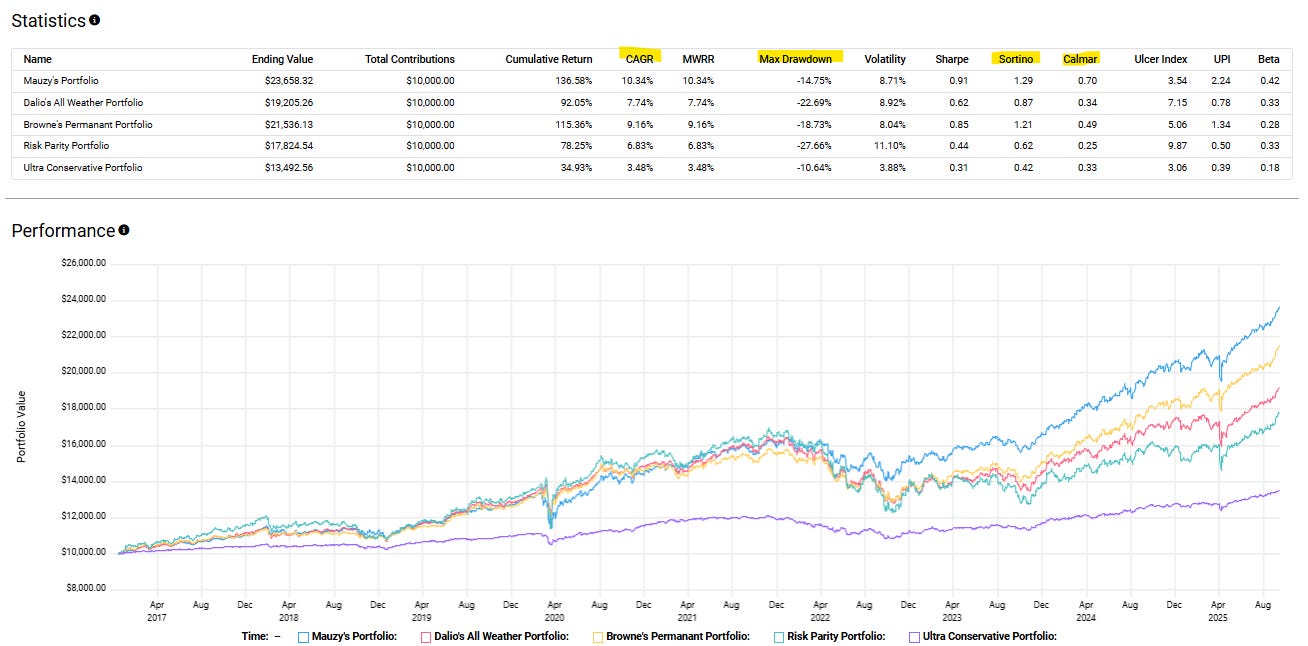
(Sidebar: The scenarios run with the conservative portfolio were run assuming annual rebalancing to the original allocations. If they had been allowed to run without rebalancing, my portfolio rises to second in the scenario that ends before the Federal Reserve began raising interest rates. It extends its lead through today. You might hate volatility, but the more of it you can tolerate, the better. Returns from equities always matter.)
Given the thousands of publicly traded ETFs that cover nearly every gamut of the investing sphere, millions of additional conservative allocation combinations can be readily conjured, but we have to stop somewhere. Through it all, this general rule holds: the lower the risk (volatility), the lower the expected return. General, because the past isn’t always prologue, but it’s the best we have to run with.
NOW FOR THE BOLD-FONT FINE PRINT: DYR (Do Your Research). I am not your investment advisor. This should not be construed as investment advice. It is information. I have opinions. What works for me might not work for you. Always remember the buck stops (and starts) with you, and you know you better than anyone. or at least, you should.
DISCLAIMER: THE AUTHOR DOES NOT GUARANTEE THE ACCURACY OR COMPLETENESS OF THE INFORMATION PROVIDED ON THIS PAGE. THE INFORMATION CONTAINED ON THIS PAGE IS NOT AND SHOULD NOT BE CONSTRUED AS INVESTMENT ADVICE AND DOES NOT PURPORT TO BE AND DOES NOT EXPRESS ANY OPINION AS TO THE PRICE AT WHICH THE SECURITIES OF ANY COMPANY MAY TRADE AT ANY TIME. THE INFORMATION AND OPINIONS PROVIDED HEREIN SHOULD NOT BE TAKEN AS SPECIFIC ADVICE ON THE MERITS OF ANY INVESTMENT DECISION. INVESTORS SHOULD MAKE THEIR INVESTIGATION AND DECISIONS REGARDING THE PROSPECTS OF ANY COMPANY DISCUSSED HEREIN BASED ON SUCH INVESTORS’ REVIEW OF PUBLICLY AVAILABLE INFORMATION AND SHOULD NOT RELY ON THE INFORMATION CONTAINED HEREIN.