

How to Get 100% More Annualized Return on Your Stock Investments
Yes, you have to assume additional risk, but perhaps less risk than you think.

I riff frequently on investing in these pages. It’s the background. I am a Chartered Financial Analyst (CFA). I have been immersed in the investment world for nearly forty years now.
Besides, the soil is ridiculously fertile for scribblers like me. The terrain is evergreen. Commentaries on investing, like commentaries on weight loss and self-improvement, are devoured as voraciously as pizza is devoured by pot-huffing teenagers. And as in the drug trade, plenty of people — including yours truly — are willing to step forward with supply to meet demand. (Substack is proof enough.) But caveat emptor, as always. All you have to go on is our word, so tread carefully.
Portfolio construction is a recurring theme for me in these latter stages of my career. The older I get, the more convinced I am that individual investors should eschew individual stock selection. Most investors I have found, and to be sure, the evidence is mostly anecdotal, lack the knowledge and temperament to succeed at individual stock selection and the construction of portfolios thereof. Worse, they approach the task with unrealistic expectations. (One newbie investor, a not-callow man in his mid-fifties, asked me how he could generate $5,000 in monthly income with a $10,000 investment. He asked in all sincerity.)
To plug away investing for a market-rate of return is an honorable enough pursuit and one not to be readily dismissed. The S&P 500 was officially launched in 1957. It has generated a 10.4% average annual return (with dividend reinvestment) over the past 68 years. The average annual return is consequential, and so consequential that Warren Buffett bet $1 million that no hedge fund could beat it over a decade. Buffett won the bet.
To keep at it with an S&P 500 ETF and succeed requires sufficient discipline and even heroic doses of fortitude on occasion. During the 2008 Financial Crisis, the S&P 500 suffered a quite unsettling 55% drawdown.
Some of us, though, find the thought of melding with the crowd, settling for average, off-putting. The ego elbows us on for more. More is possible without resorting to individual security selection — and the inevitable dreaming of the next Nvidia (NVDA) it inspires. Broad-based investing can beat broad-based investing if one is willing to incorporate leverage, another subject I have broached in these pages.
Democratization is the reason.
Leverage has never been easier for individual investors to incorporate into their portfolios without resorting to margin borrowing. Leverage ETFs, a novelty a decade ago, approach respectability today. These handy little ETFs come pre-loaded with leverage. They enable investors to create leveraged portfolios with broad-based ETF — stocks and bonds — sector indices, such as the iShares Semiconductor ETF (SOXX), and the most popular individual stocks. All sans the risk of the dreaded margin call.
The market is standardized. Leveraged ETFs come in two primary sizes, 2X and 3X, and in two primary strategies, bullish and bearish. They enable you to assume a leveraged stance for or against, and to pursue your conviction to the zeal you can tolerate.
I perceive leveraged ETFs first as tools, and tool is the right word. A tool is a marvelous device to manifest efficiency when used correctly. But as with any tool, when used incorrectly, it can manifest pulverizing destruction.
I prefer to use them correctly. Because I don’t day trade, I eschew all leveraged single-stock ETFs and most sector-leveraged ETFs. (I will speculate occasionally with a leveraged sector ETF, but only if it trades at a 70% or greater discount to its previous high, and that’s only the starting point.) I don’t buy the bearish ETFs (inverse), having been burned too often short selling in my early year, I am more than twice burned and hopelessly shy.
(Sidebar: Two characteristics of leveraged ETFs investors need to know. They are susceptible to intense volatility decay, and they settle daily. Leverage amplifies volatility decay, which will accelerate losses in a down market and will lead to losses in a trendless market. Even if a stock were to only trade up 5% one day and down 5% the next, it will eventually trade to near zero should the to-and-fro exchange persist over ample time. Daily settlement means the ETF will deviate from the 2X and 3X increment with the unleveraged index it tracks over time. Because of these characteristics, commentators will assert that leveraged ETFs are only day-trading instruments. Some are, but not all. How they are combined into a portfolio matters.)
What about that “100%” more of something in my clickbaiting headline? Yes, it exists. Leverage can do that for you.
Three S&P 500 ETFs are represented in the chart below: The unleveraged SPDR S&P 500 ETF (SPY), the 2X leveraged ProShares Ultra S&P 500 ETF (SSO), and the 3X ProShares UltraPro S&P 500 ETF (UPRO).
The unleveraged S&P 500 ETF generated a 14% CAGR over the past 15 years. The 2X variant was 50% better, generating a 22% CAGR. The 3X ETF’s 29% CAGR is double (more than) the unleveraged ETF’s CAGR. Voilà — a 100% (more than) return.
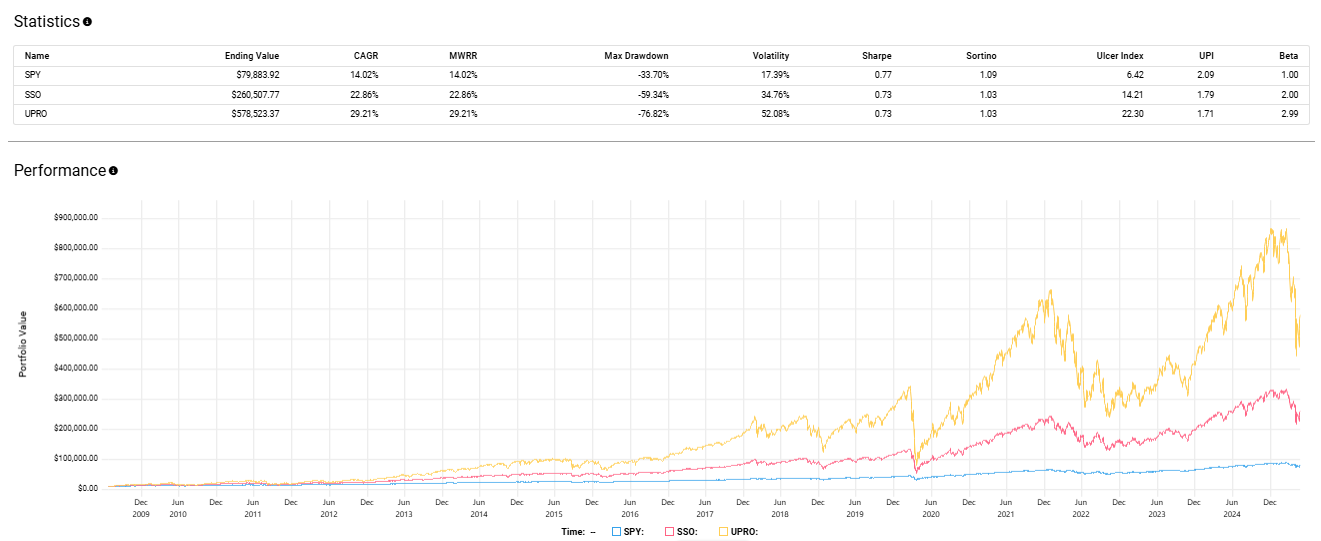
The difference in terminal wealth is a big deal, but hardly a gimme, as you may have inferred from the chart. The price movement of the 3X S&P 500 ETF resembles an outline of the Himalayas; the 2X, the Appalachians; and the unleveraged, the Kansas plains. Additional price volatility and higher drawdowns are the price paid for the higher return. Indeed, the 2X and 3X ETFs were two and three times more volatile in daily trading than the unleveraged alternative. This is to be expected, of course.
As for the max. drawdowns, they must be considered with monastic seriousness. The unleveraged S&P 500 suffered a 33% drawdown the month after Covid swamped the world. The 2X variant suffered a 60% drawdown; its 3X brethren, a 76% drawdown. If I may channel Mike Tyson for a moment, to say you can take a punch to the mouth is one thing; to actually take a punch to the mouth is another entirely. You might tolerate watching your $100,000 investment shrink to $67,000, but tolerate it shrinking to $40,000, much less withering to $24,000, really?
And what if it had been 2008?
ProShares’ 3X leveraged ETF was only a concept during the great financial crisis and the bear market it propagated, but its 2X ETF was very real. The S&P 500 ETF suffered night-sweat-inducing 55% drawdown, the worst since the Great Depression. The 2X ETF derivative suffered a Jesus-begging 85% drawdown. Had the 3X ETF been extant, its drawdown would have been someone in the 90s. The unleveraged S&P 500 ETF required four years to get back to square one, and the 2X leveraged S&P 500 ETF required six years. We can only guess at the 3X, and a decade would be reasonable.
Setting aside the volatility, the periodic drawdowns, and the anxiety they foment, the leveraged S&P 500 generated superior returns with a buy-and-hold strategy and quarterly rebalancing (periodic rebalancing is a must with leveraged portfolios). They withstood the volatility decay, which shouldn’t register as a surprise. The S&P 500 has historically been an upward-trending index.
Because financial crises lurk in the shadows, ready to spring forth instanter to discombobulate like the loathsome YouTube prankster, we diversify our portfolio. Leveraged diversified portfolios are not only possible, but they’re also practicable within the realm of reason.
We need look no further than the classic 60/40 portfolio — 60% stocks (usually proxied by the S&P 500) and 40% U.S. Treasury securities (usually allocated to notes and bonds). We can construct the classic 60/40 portfolio unleveraged, 2X leveraged, and 3X leveraged.
(Sidebar: You can also buy the classic 60/40 pre-fabbed and leveraged at 1.5X in one ETF — the Wisdom Tree U.S. Efficient Core Fund.)
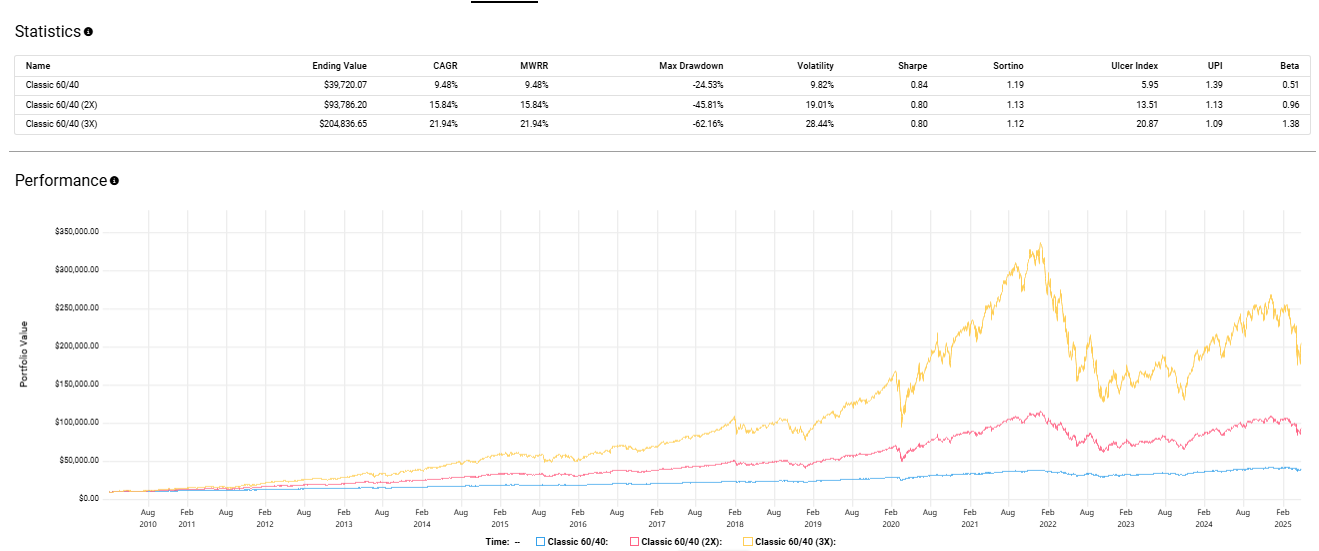
The unleveraged classic 60/40 generated a 9.4% CAGR over the past 15 years. The leveraged 2X and 3X portfolios generated CAGRs of 15.8% and 21.9%, respectively. But you knew this.
As you also knew, the leveraged portfolios were imbued with more volatility and more punishing drawdowns. On the latter, the unleveraged portfolio endured a 24% drawdown. The revved-up leveraged versions endured 46% and 62% drawdowns, respectively. The drawdown on all fronts is a big deal. It coincided with the unusual dual bear market in stocks and bonds in 2022.
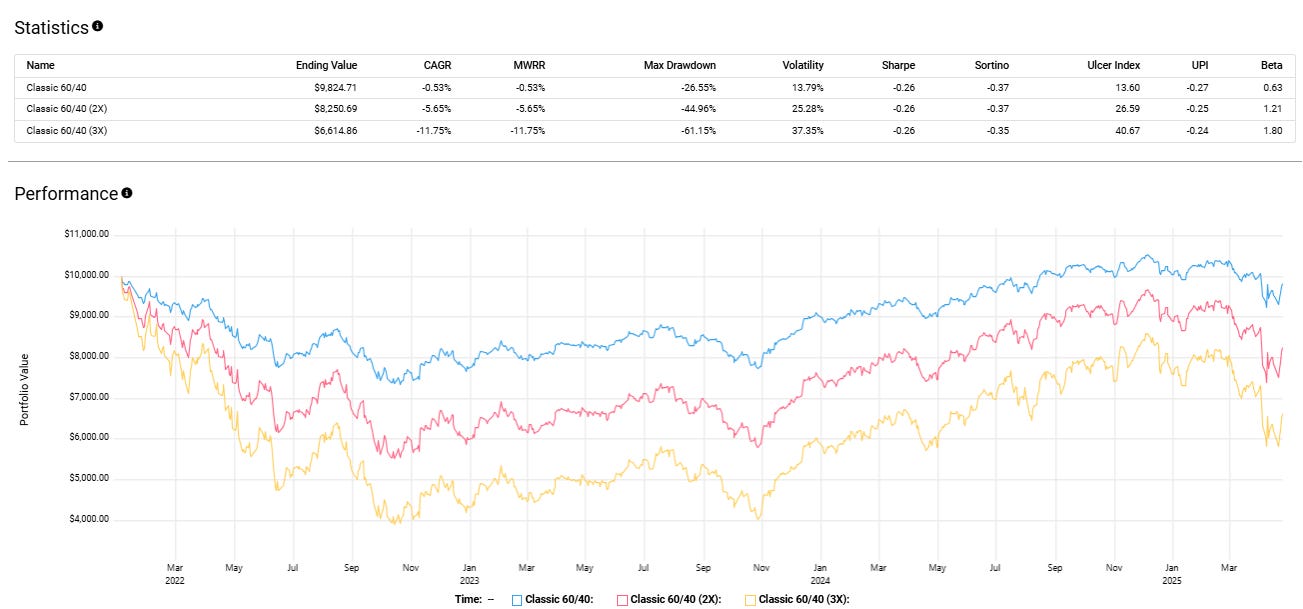
Time is always as prime consideration because it’s never infinite. With leverage, the more of it at your disposal, the better. If you had owned a classic 60/40 portfolio — unleveraged and leveraged 2X and 3X — entering 2022, you’d still be in the red today, even with the unleveraged version (which is close to breakeven), but with the leveraged versions, you’d be deeper in the red and have some clawing to do before reaching square one.
Since we’ve entered the 2020s, leveraged ETF offerings have multiplied at a rate that would make orthodox Jewish, traditional Catholic, and fundamentalist Christian parents appear chaste. Like any proliferation, we have the good and bad.
As for the good, I like the opportunity leveraged ETFs offer to generate alpha through leverage within a diversified portfolio. The strategy is easier to implement and to adhere to compared to a portfolio composed of individual stocks and bonds. As for the bad, good luck day-trading the leveraged Tesla ETF to realize your champagne riches and caviar dreams. You’ll be reduced to Keystone Light and Slim Jims.
The choice needn’t be either/or.
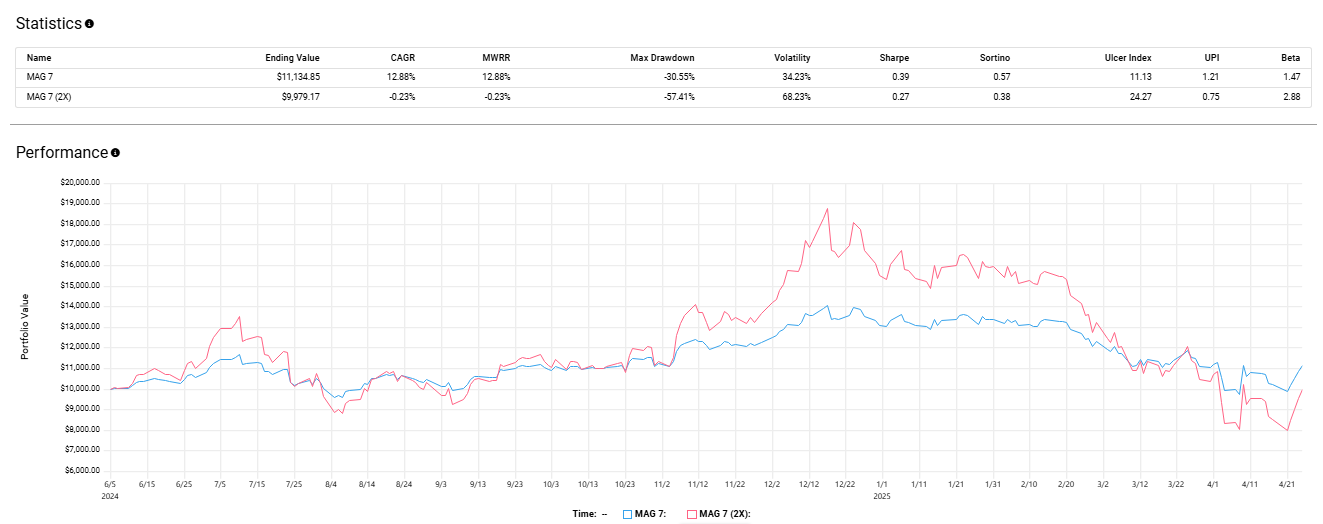
Sophisticated individual investors can manufacture different portfolio tranches with differing risk-return characteristics. For high-risk tranches, a portfolio can be constructed with leveraged individual stocks. I give you the MAG-7 as an example.
Leveraged individual stock ETFs invaded the market in force last year. All are derivatives of the largest S&P 500 stocks. You want a MAG-7 allocation leveraged 2X? No problem. Here you go, just don’t underestimate the volatility and the drawdowns. When times are good, as they were in 2024, they’re very good And when they’re not. as they’ve been in 2025, just eyeball the cart below.
We understand the shortcomings: volatility decay and the daily reset are front and center, but for broad-based indices whose long-term history is upward trending (as opposed to cycle), the opportunities are intriguing. As someone who has used leverage in the past and still uses it today, albeit conservatively, I appreciate eschewing margin (unless I am stupid enough to buy leveraged ETFs with margin, which I haven’t).
Take the aforementioned leveraged ETF insight for what it is — information. If you’re interested in exploring the possibilities, you can peruse the offerings of ProShares and Direxion. They are the two leading (and established) leveraged ETF sponsors.
And if leveraged ETFs aren’t your thing, but you are interested in constructing efficient investment portfolios — with stocks, ETFs, mutual funds, and other publicly traded investments, good for you. I have a couple of tools to assist with the task.
The portfolio charts above were created at testfol.io. Portfoliovisualizer.com is another useful tool. They are free, and they enable you to mix and match publicly traded securities (including leveraged ETFs) across different asset classes and different time horizons to set expectations on performance and risk to your heart’s content. I find the insights valuable. At the least, they enable me to reasonably model reality and set expectations accordingly.
Our eyes are reflexively drawn to the annualized average return. The higher, the better is the first perception. We know, though we’ll often ignore, our return is saddled with risk. After all, the return unsaddled with risk offers return. Risk-free investments pay nothing. Risk is conflated with volatility and drawdowns, a proper interpretation for a diversified portfolio. (Permanent loss of capital is also associated with risk, which is most associated with sequence risk. Sequence risk coincides with the time you start withdrawing from your portfolio. The same portfolio is a different beast when withdrawals are taken during a bull market or a bear market.)
The two portfolio analyzing tools I link to go beyond the average annual return over the time specified. They offer the maximum drawdown, daily volatility, the Sharpe and Sortino ratios, and the beta. The max. drawdown and Sortino ratio I find most useful. The max. drawdown is obvious. It reveals the max loss suffered during the holding period. The Sortino ratio gives the return received for the risk (volatility) assumed. The higher the Sortino ratio, the more efficient the portfolio.
Here are a few sample portfolios to get you started. You can construct them with unleveraged (regular) and leveraged ETFs. You’ll find commodity and gold ETFs should the portfolio call for them, and yes, you’ll find leveraged commodity and gold ETFs, too, if that’s how you want to swing.
Ray Dalio All Weather Portfolio Asset Allocation:
30% U.S. Stocks
40% Long-Term Treasury Bonds
15% Intermediate-Term Treasury Bonds
7.5% Commodities
7.5% Gold
Harry Browne Permanent Portfolio:
25% Total US Stock Market
25% Long-Term Bonds
25% Cash
25% Gold
Golden Butterfly Portfolio:
20% Total US Stock Market
20% US Small Cap Value
20% Long-Term Treasury Bonds
20% Short-Term Treasury Bonds
20% Gold
William Bernstein No Brainer Portfolio:
25% US Large Cap Blend
25% US Small Cap Blend
25% International Stocks
25% Short-Term Bonds
David Swensen Portfolio (Yale Model):
30% Total Stock Market
15% International Stock Market
5% Emerging Markets
15% Intermediate Treasury Bonds
15% TIPS
20% REITs
Ben Felix Model Portfolio:
42% U.S. Stock Market
24% International (ex-US) Developed Markets
12% Emerging Markets
14% U.S. Small Cap Value
8% International (ex-US) Small Cap Value
I have no dog in the fight with any of these portfolios. Feel free to experiment with the two analysis tools provided. Alter the allocations and time frames, if you will. Compare leveraged with unleveraged. Heed the returns. More importantly, heed the risk factors — max. drawdown, volatility, Sortino ratio, and beta — incurred to generate the returns.
You’re well served to witness how a portfolio has performed over extreme events: the 2008 Financial Crisis, the onset of the Covid pandemic (2020), the bond and bear market of 2022, and the 2025 presidential-induced tariff stupidity labeled in true Orwellian form “Liberation Day.” Eye-popping annualized returns are great; mouth-punching volatility and max. drawdowns, not so much. It’s always worthwhile to have an idea of how hard the punch can be and how much of it you can withstand.
NOW FOR THE BOLD-FONT FINE PRINT: I have no business relationship with any of the ETFs sponsors or analytical tools mentioned. They don’t know me; I don’t know them. DYR (Do Your Research). I am not your investment advisor. The text above should not be construed as investment advice. It is information. I have opinions. What works for me might not work for you. For most people, the strategies mentioned will not work because of the risk tolerance and discipline required. Always remember the buck stops (and starts) with you, and you know you better than anyone. or at least, you should.
DISCLAIMER: THE AUTHOR DOES NOT GUARANTEE THE ACCURACY OR COMPLETENESS OF THE INFORMATION PROVIDED ON THIS PAGE. THE INFORMATION CONTAINED ON THIS PAGE IS NOT AND SHOULD NOT BE CONSTRUED AS INVESTMENT ADVICE AND DOES NOT PURPORT TO BE AND DOES NOT EXPRESS ANY OPINION AS TO THE PRICE AT WHICH THE SECURITIES OF ANY COMPANY MAY TRADE AT ANY TIME. THE INFORMATION AND OPINIONS PROVIDED HEREIN SHOULD NOT BE TAKEN AS SPECIFIC ADVICE ON THE MERITS OF ANY INVESTMENT DECISION. INVESTORS SHOULD MAKE THEIR INVESTIGATION AND DECISIONS REGARDING THE PROSPECTS OF ANY COMPANY DISCUSSED HEREIN BASED ON SUCH INVESTORS’ REVIEW OF PUBLICLY AVAILABLE INFORMATION AND SHOULD NOT RELY ON THE INFORMATION CONTAINED HEREIN.